
UCI Online Retail II: 1,067,371 transaction lines across sales, returns, customers, products, time and 43 countries.
Evidence • Method • Insight • Decision
Proof should show
how the thinking works.
Our demonstration projects are designed to make our approach visible: the business question, the evidence, the analytical method, the commercial implication and the recommendation. They are clearly labelled and are not presented as client engagements.
Proof before promotion
We would rather show the work
than manufacture credibility.
These projects are independent demonstrations of capability.
Each project starts with a realistic management question and uses appropriate public, open or otherwise legitimately available evidence. The purpose is to demonstrate analytical depth, decision framing, communication quality and practical recommendations before a large client case-study library exists.
01 No invented clients.
02 No fabricated results.
03 Methods and limitations made visible.
04 Client work added only with appropriate permission.
Demonstration portfolio
Six business questions.
Six different evidence paths.
Projects 01 and 02 are completed studies, Project 03 is a live executive dashboard, and Project 06 is a live AI prototype. Projects 04 and 05 remain in development.

01Demonstration projectCompleted study
Revenue Intelligence
Where is commercial value being created, lost or overlooked?
Using 1.07 million retail transaction lines, this completed study turns sales and customer data into a reconciled view of revenue growth, return leakage, concentration, retention and commercial opportunity.
Decision challenge
Management sees the headline revenue number, but needs to understand the customers, products, channels or behaviours actually driving performance.
Transaction-semantics audit, revenue reconciliation, RFM segmentation, customer concentration, cohort retention, product, basket and geographic analysis.
£19.38m net merchandise sales, a 3.6% return-value rate and 63.3% of identified-customer net sales concentrated in the top 10% of customers.
Move from “revenue changed” to evidence on growth quality, high-value customer dependency, return exceptions, repurchase behaviour and testable growth priorities.

02Demonstration projectCompleted study
Market & Growth Intelligence
Where should broadband expansion happen first?
Using NBS, NCC and current provider evidence, this completed study moves from national broadband momentum to state screening, infrastructure feasibility, pricing evidence and a cluster-first commercial entry strategy.
Decision challenge
Leadership is considering broadband expansion in Nigeria and needs to distinguish large demand pools from commercially testable fixed-broadband micro-markets.
NBS state internet subscriptions, population and IGR data; NCC broadband, ISP, FTTX and infrastructure evidence; current public provider offers.
Rule-based market screening, demand/commercial-capacity segmentation, infrastructure and competitor evidence review, pricing benchmarks and scenario sequencing.
The evidence supports cluster-first validation in Lagos, FCT, Ogun and Rivers rather than a statewide or nationwide fibre rollout.
Separate attractive market scale from investable micro-market economics and define what must be validated before capital is committed.

03Demonstration projectLive dashboard
Executive Business Intelligence
What should leadership be able to see every week without asking for another spreadsheet?
This completed demonstration connects 121,253 sample sales lines and 776,286 inventory records to an interactive dashboard, defined KPIs and a management reporting guide.
Decision challenge
Leaders receive many reports but still lack a consistent, trusted view of performance, exceptions, trends and areas requiring intervention.
Microsoft AdventureWorksDW fictional sample data: sales, product cost, channels, categories, territories and daily inventory.
KPI architecture, metric definition, data modelling, dashboard design, exception logic and executive reporting workflow.
Filterable executive dashboard, reconciled metrics, stock exception list, KPI dictionary and reporting guide.
Reduce reporting noise and make the information that requires management attention easier to identify and act on.

04Demonstration projectLive assessment & model
AI & Workflow Automation
Where can AI remove real work rather than add another tool?
This completed demonstration combines an editable workflow business case with a trained inbox-screening model, held-out evaluation and a human review desk.
Decision challenge
An organisation wants to adopt AI, but needs to identify which repetitive information workflows are worth changing and how to do so responsibly.
5,574 public source messages, 5,086 retained unique records, 763 held-out test messages, and explicit workflow assumptions.
Workflow decomposition, TF–IDF classification, error analysis, human review, scenario economics and implementation sequencing.
Live assessment, browser-based model, adjustable review policy, downloadable assumptions, evaluation and implementation controls.
Separate useful AI opportunities from fashionable ones and focus investment on measurable productivity or quality improvement.

05Demonstration projectLive evidence desk
Customer & Operational Intelligence
Which customer issues deserve operational attention first?
A completed analysis of 28,889 public checking-and-savings complaints connects reported issues, response records and operational handoffs through an interactive evidence desk.
Decision challenge
A high timely-response rate can conceal recurring issues. Management needs to distinguish complaint volume, response exceptions and the case evidence required to investigate them.
CFPB Consumer Complaint Database: Q1 2025 complaint issues, submission channels, company responses and receipt-to-forwarding timestamps.
Issue and channel segmentation, exception-burden comparisons, median forwarding intervals, scope controls and reproducible source audits.
Interactive evidence desk, scoped CSV exports, management brief, validation controls and an improvement measurement framework.
Prioritise case review, identify the next operational data needed and measure changes without mistaking response flags for customer satisfaction.
Agentic AI · Five industry operating systems
One collection.
Built around how each industry works.
Explore AI connected to operating records, business questions and controlled actions. Each sector has its own demonstration and case page as it is completed.
01Live demo
Real estate
CedarStone AI
Sales, shortlets, facilities, construction and finance.
Explore CedarStone AI02Live demo
Logistics
RelayPoint AI
Shipment visibility, delivery exceptions and dispatch priorities.
Explore RelayPoint AI03Live demo
Manufacturing & energy
ForgeWorks AI
Production evidence, material exposure, maintenance and energy cost.
Explore ForgeWorks AI04Live demo
Healthcare
CareBridge AI
Appointment coordination, room readiness and billing follow-up.
Explore CareBridge AI05Live demo
Education
Crestfield College AI
Attendance, lesson cover, term fees and admissions paperwork.
Explore Crestfield College AI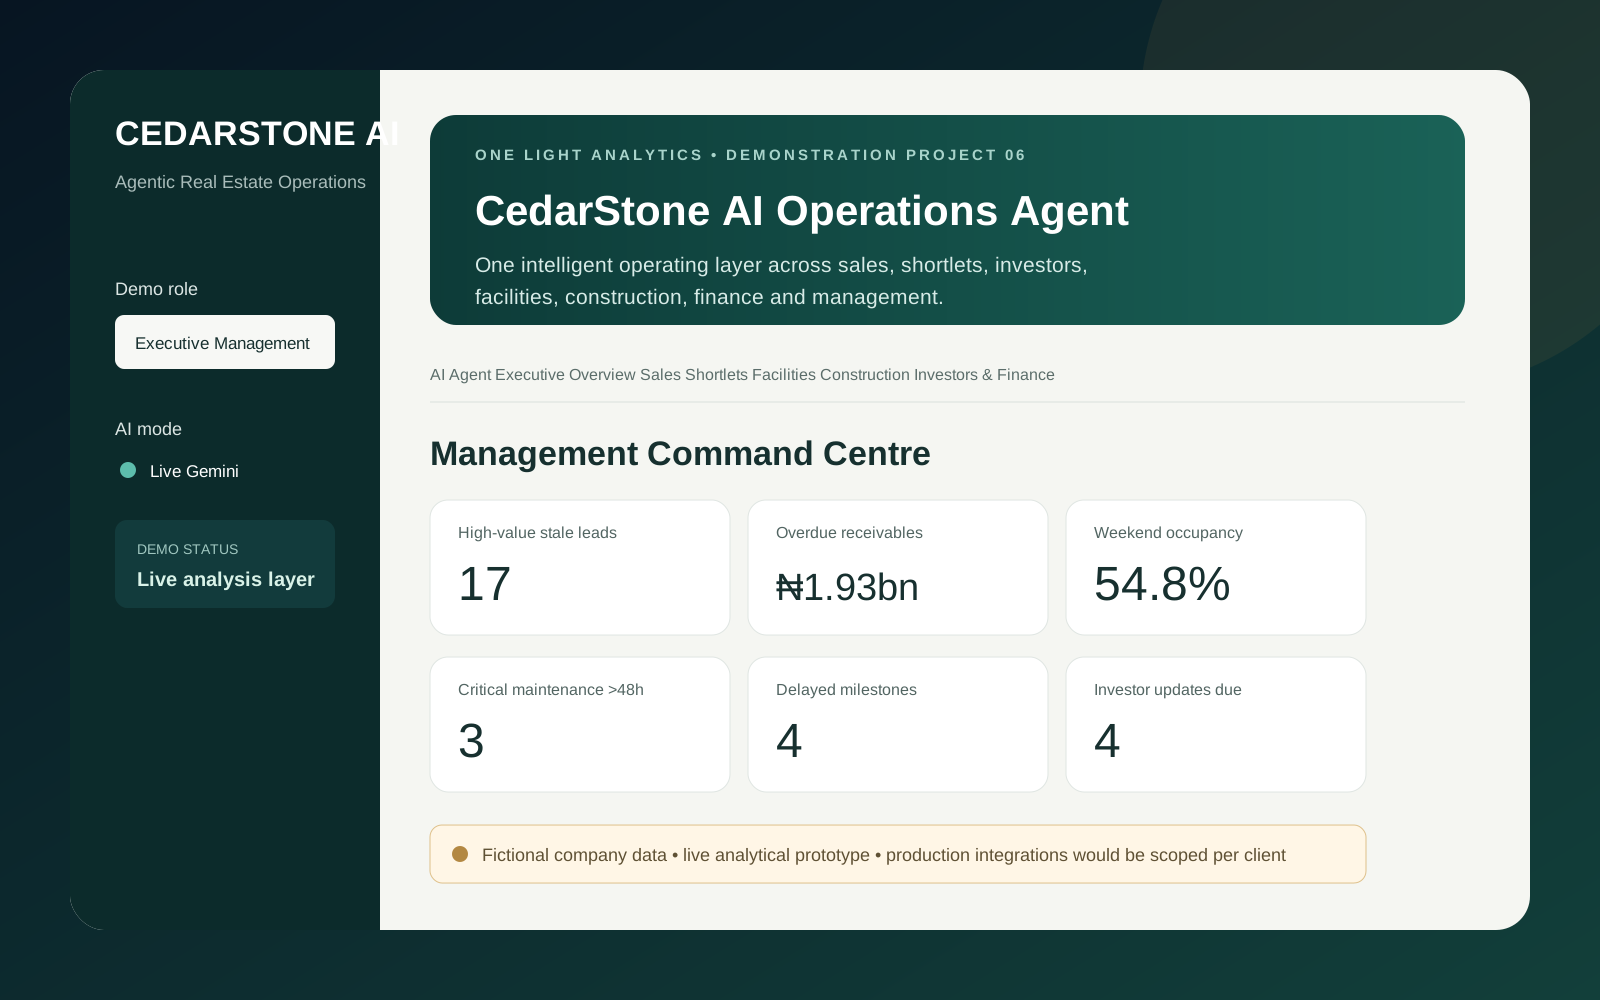
01Sector AI · Real estateLive prototype
CedarStone AI · Agentic Real Estate Operations
What if management could ask the business a question and the operating data answered back?
CedarStone AI is a working demonstration for a fictional full-service real-estate company. It connects management visibility across sales, shortlets, facilities, construction, investors and finance through one conversational operating layer.
Decision challenge
Critical information is often fragmented across teams, spreadsheets and systems. Management needs a faster way to see what requires attention, understand why and investigate the records behind the issue.
A realistic fictional operational database covering properties, leads, bookings, investors, receivables, maintenance, construction milestones, employees and vendors.
Role-aware AI tools, live Gemini reasoning, operational dashboards, conversational analysis, private demo sessions and activity logging.
Executive briefings, stale-lead detection, shortlet occupancy, receivables, investor updates, maintenance escalation and construction-delay diagnosis.
Demonstrates how fragmented operational data can become a shared management intelligence layer instead of another static dashboard.
The case-study standard
As proof grows, every case should answer five questions.
Completed demonstration studies and approved client case studies will use a consistent evidence structure so readers can distinguish method, finding and business consequence.
- 01Context
What was the decision, problem or opportunity?
- 02Method
What evidence and analytical approach were used?
- 03Finding
What did the evidence actually show?
- 04Commercial implication
Why did the finding matter for the organisation?
- 05Recommendation
What should management do next?
Your question does not need to look exactly like these
Bring us the decision. We will design the evidence path.
Tell us what management is trying to understand, decide or improve. We will help frame the question and determine the research, analytics or technology required.